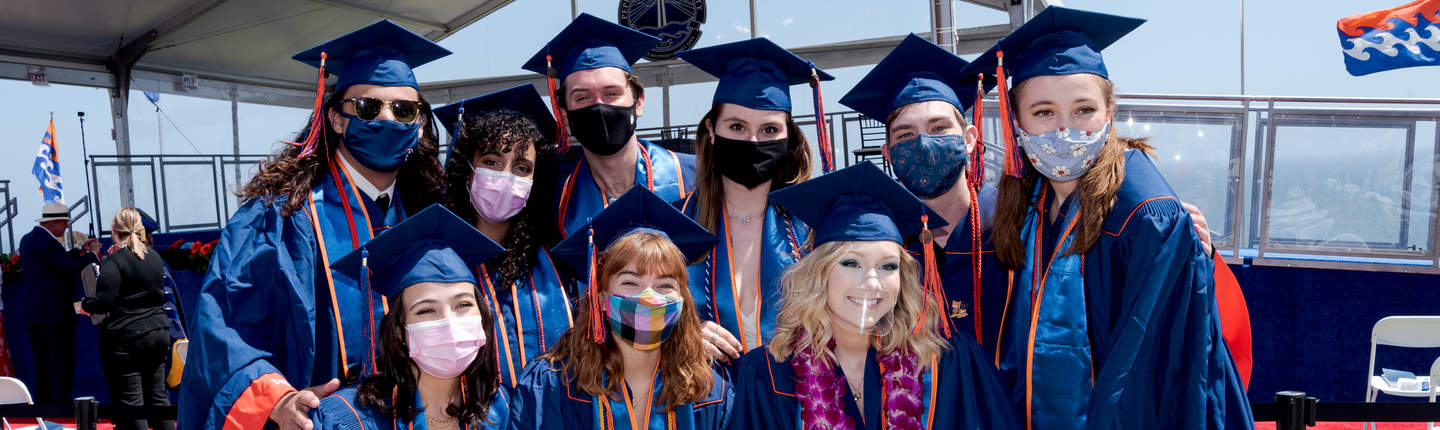
Success After Seaver: Class of 2020
Seaver College is committed to tracking the successes of our graduates. Our data collection is guided by the procedures outlined by the National Association of Colleges and Employers and is collected six months after graduation. This data is often called graduation outcomes or career outcomes. Students who are employed full or part-time, volunteering full-time, in graduate school, or serving in the military are considered to have a recognized professional outcome. We have information on 96% of the graduating class, also known as a 96% knowledge rate.
employed, in grad school, volunteering full time, in the military
grad school acceptance rate
What 2022 Grads are Doing
The 2022 Seaver College graduating class consisted of 879 students. Of the 86% who are settled at six months after graduation, 63% are employed, 18% have been admitted to graduate school and 1% are either in the military or volunteering full-time with organizations such as the Peace Corps or Fulbright.
| 63% Employed |
| 18% Grad School Admitted |
| 1% Full-Time Service or Military |
Graduate School Breakdown
Twenty-six percent of the 2020 class chose to continue their education in a graduate program. Of those seeking admittance to grad school, 90% received admission. The top three areas of study were in arts and sciences, law, and business.

-
Arts & Sciences (35%)
-
Business (12%)
-
Medicine (11%)
-
Law (19%)
-
Therapy (10%)
-
Public Policy (7%)
-
Education (5%)
Testimonials
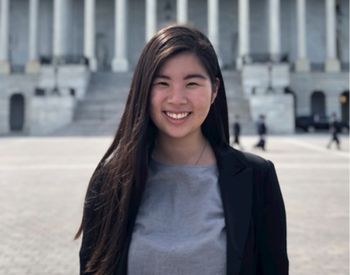
The skills that Pepperdine equipped me with go beyond what is taught in the classroom. My Pepperdine education not only gave me the technical skills I need for the day-to-day, but also shaped me to become a stronger communicator and a servant-leader. In my role, I work with executives from global nonprofits to strategize and execute their organization's communications goals. My days are filled with driving regional and national media campaigns and helping clients navigate crises and emerge as thought leaders in their industries. For every brief moment I take to celebrate an accomplishment, I’m constantly challenging myself to keep growing and to become a better leader, communicator, and friend.
Account Executive, Pinkston
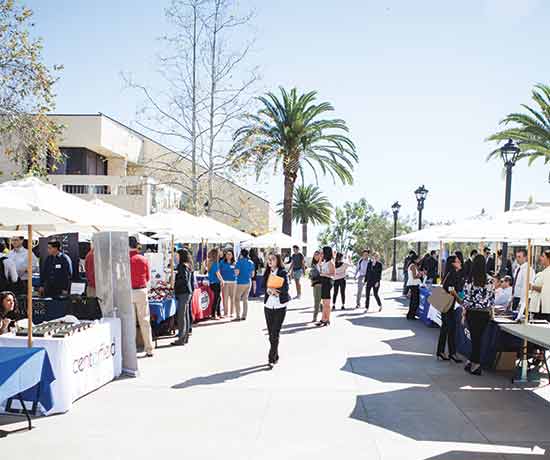
Where Grads Work and Study
United States
- New York City
- Washington DC
- San Francisco
- Seattle
- San Diego
- Los Angeles
- Denver
- Orange County
- Atlanta
- Chicago
- Boston
- Dallas
- South Bend, Indiana
- Waco, Texas
- Nashville
- Houston
- Austin
- Las Vegas
- San Antonio
- Philadelphia

International
- London
- Hong Kong
- Seoul
- Sydney
- Jakarta, Indonesia
- Madrid