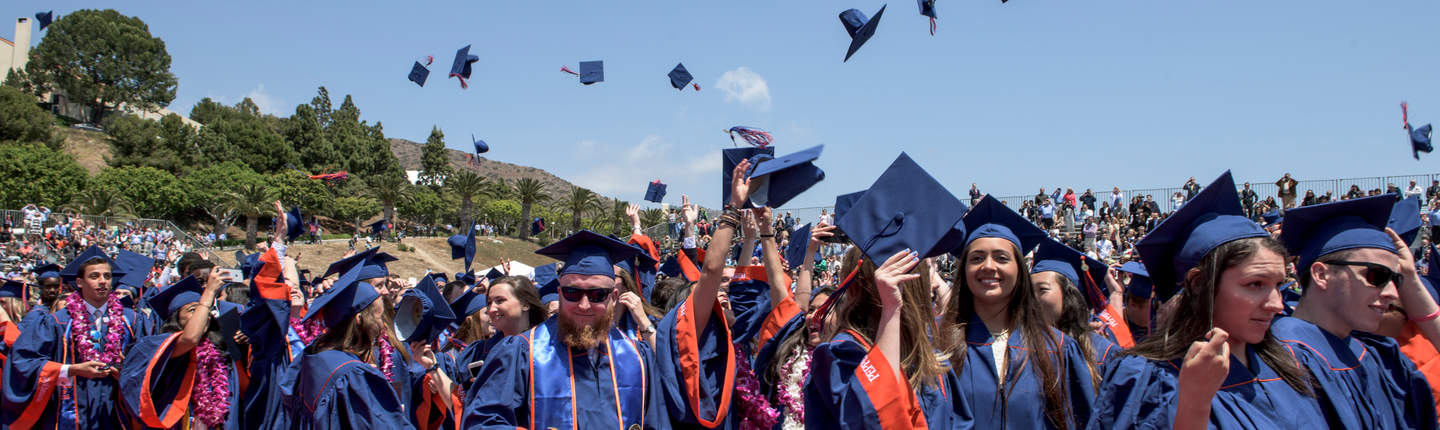
Success After Seaver: Class of 2019
![]()
Seaver College is committed to tracking the successes of our graduates. Our data collection is guided by the procedures outlined by the National Association of Colleges and Employers and is collected six months after graduation. This data is often called graduation outcomes or career outcomes. Students who are employed full or part time, volunteering full time, in graduate school or serving in the military are considered to have a recognized professional outcome. We have information on 96% of the graduating class, also known as a 96% knowledge rate.
employed, in grad school, volunteering full time, in the military
grad school acceptance rate
What 2019 Grads are Doing
The 2019 Seaver College graduating class consisted of 803 students. Of the 90% who are settled at six months after graduation, 69% are employed, 19% have been admitted to graduate school and 2% are either in the military or volunteering full time with organizations such as the Peace Corps or Fulbright.
| 69% Employed |
| 19% Grad School Admitted |
| 2% Full-Time Service or Military |
Graduate School Breakdown
Nineteen percent of the 2019 class chose to continue their education in a graduate program. Of those seeking admittance to grad school, 85% received admission. The top three areas of study were in arts and sciences, business, and education.

-
Arts & Sciences (37%)
-
Business (12%)
-
Education (11%)
-
Law (23%)
-
Medicine (7%)
-
Public Policy (6%)
-
Therapy (5%)
Testimonials
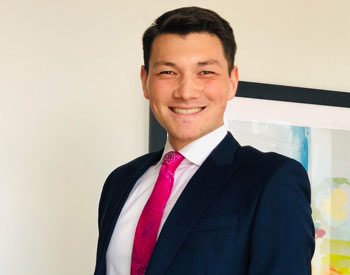
Pepperdine equipped me with an incredibly well-rounded education. In my role, I have the privilege of interacting with individuals and institutions that span the geographical and cultural spectrum—and my education pushed me to be more adaptive, inquisitive, and analytical. I drink from a firehouse of information on a daily basis, as I start and end my day trying to understand what happened in the U.S. market and economy. My days are filled with conversations and meetings with firms and individuals all over Wall Street, and constant analysis of trends in investor behavior, the stock market, and the overall macro environment. I am in a constant state of learning and developing my analytical and interpersonal skills; which is fostering my ability to be a more effective analyst and communicator.
Senior Investment Research, Charles Schwab
Where Grads Work and Study
United States
- New York City
- Washington DC
- San Francisco
- Seattle
- San Diego
- Los Angeles
- Denver
- Orange County
- Atlanta
- Chicago
- Boston
- Dallas
- South Bend, Indiana
- Waco, Texas
- Nashville
- Houston
- Austin
- Las Vegas
- San Antonio
- Philadelphia

International
- London
- Hong Kong
- Seoul
- Sydney
- Jakarta, Indonesia
- Madrid