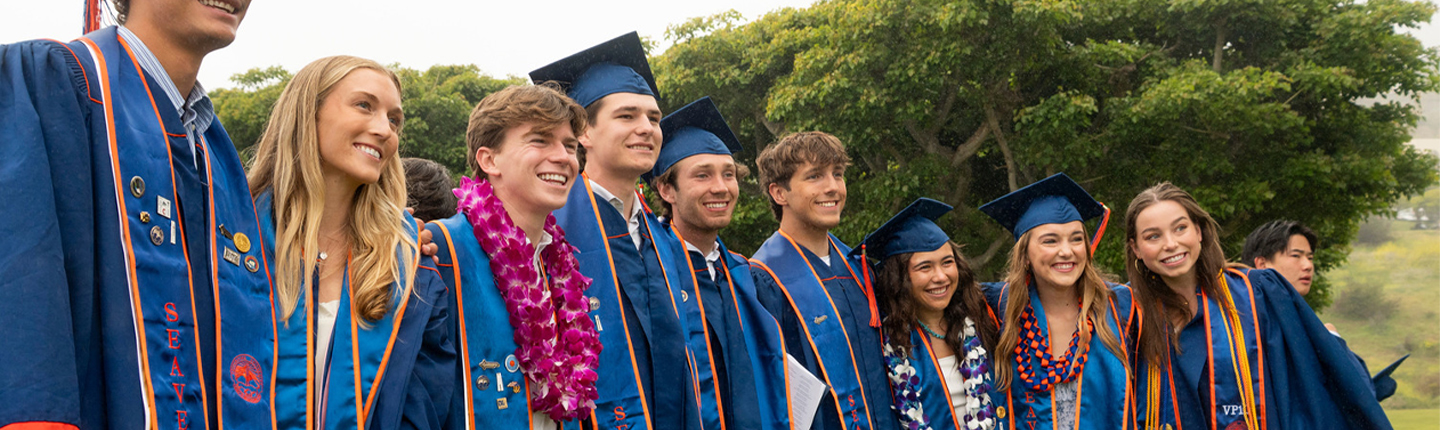
Success After Seaver: Class of 2025
Seaver College is committed to tracking the successes of our graduates. Our data collection is guided by the procedures outlined by the National Association of Colleges and Employers and is collected six months after graduation. This data is often called graduation outcomes or career outcomes. Students who are employed full or part-time, volunteering full-time, in graduate school, or serving in the military are considered to have a recognized professional outcome. We have information on 96% of the graduating class, also known as a 96% knowledge rate.
employed, in grad school, volunteering full time, in the military
grad school acceptance rate
What 2025 Grads are Doing
The 2025 Seaver College graduating class consisted of 966 students. Of the 82.4% settled within six months from graduation, 56% are employed, 24% are continuing education, and ~1% are either in the military or volunteering full-time with organizations such as the Peace Corps or Fulbright.
| 56% Employed |
| 24% Continuing Education |
| ~1% Full-Time Service or Military |
Graduate School Breakdown
24% of the class of 2025 chose to continue their education in a graduate program. Of those seeking admission to grad school, 84% received admission. The top three areas of study were in law, business, and arts and sciences.

-
Law (37%)
-
Business (18%)
-
Arts & Science (18%)
-
Health Sciences (7.5%)
-
Therapy (6%)
-
Public Policy (6%)
-
Education (4.5%)
-
Medicine (2%)
-
Engineering (1%)
Testimonials
Navigating post-grad is both overwhelming and exciting. With the lessons I’ve learned from Pepperdine and the consistent support from faculty and staff, I have been able to bloom into adulthood. By involving myself in several communities during my Pepperdine career, I’ve made long-lasting relationships that I can count on in the present-day and in the future. For example, I am blessed enough to work with Pepperdine alumni at Warner Music Group, keep in touch with my close friends & mentors from the psychology department, seek guidance from advisors at the Career Center, and share my favorite songs with fellow radio hosts at KWVS Radio. By leaning into Pepperdine’s close-knit culture, I was able to flourish within all of these communities and apply this sense of familiarity to post-grad life. After graduating from Pepperdine, I’m confident when applying the knowledge I’ve learned from my studies and extracurriculars to the real-world.
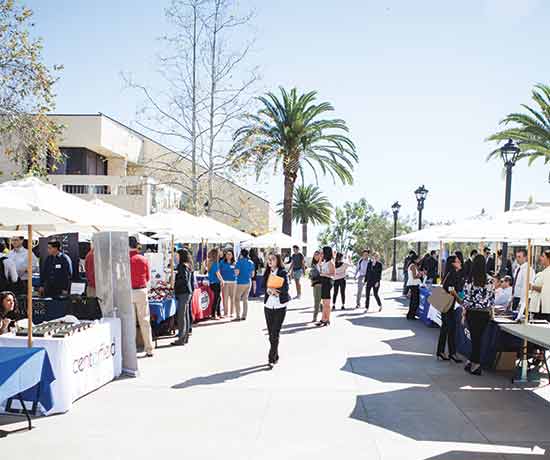
Where Grads Work and Study
United States
- New York City
- Washington DC
- San Francisco
- Seattle
- San Diego
- Los Angeles
- Denver
- Orange County
- Atlanta
- Chicago
- Boston
- Dallas
- South Bend, Indiana
- Waco, Texas
- Nashville
- Houston
- Austin
- Las Vegas
- San Antonio
- Philadelphia

International
- London
- Hong Kong
- Seoul
- Sydney
- Jakarta, Indonesia
- Madrid